Using Prometheus to collect metrics from Golang applications
Contents
This text is part of a series of posts I am doing with examples of applications using Clean Architecture. The other posts that are part of this series are:
- Clean Architecture using Golang
- Golang: using build tags to store configurations
- Continuous integration in projects using monorepo
- Data Migration with Golang and MongoDB
- Using Golang as a scripting language
- Creating test mocks using GoMock
In this post, I will talk about a very important feature in the complex projects we work with daily: metrics. Among the various solutions on the market for this purpose, one that has gained more prominence is the duo Prometheus + Grafana.
According to the description found on Wikipedia:
Prometheus is a free software application used for event monitoring and alerting. It records real-time metrics in a time series database built using a HTTP pull model, with flexible queries and real-time alerting.
And we can describe Grafana as:
Grafana is a multi-platform open source analytics and interactive visualization software available since 2014. It provides charts, graphs, and alerts for the web when connected to supported data sources.
In short, Prometheus collects data and thanks to Grafana we can create beautiful graphics and dashboards to facilitate the visualization of information.
Creating the Use Cases layer
To make use of this functionality, we need to adapt our codes so they can provide the data that Prometheus will collect and process. As we are using Clean Architecture, the first step we will do is to create a new package in our UseCases layer. Based on the repository: https://github.com/eminetto/clean-architecture-go we started by creating the pkg/metric/interface file .go, whose content is:
package metric

import "time"

//CLI define a CLI app
type CLI struct {
	Name       string
	StartedAt  time.Time
	FinishedAt time.Time
	Duration   float64
}

// NewCLI create a new CLI app
func NewCLI(name string) *CLI {
	return &CLI{
		Name: name,
	}
}

//Started start monitoring the app
func (c *CLI) Started() {
	c.StartedAt = time.Now()
}

// Finished app finished
func (c *CLI) Finished() {
	c.FinishedAt = time.Now()
	c.Duration = time.Since(c.StartedAt).Seconds()
}

//HTTP application
type HTTP struct {
	Handler    string
	Method     string
	StatusCode string
	StartedAt  time.Time
	FinishedAt time.Time
	Duration   float64
}

//NewHTTP create a new HTTP app
func NewHTTP(handler string, method string) *HTTP {
	return &HTTP{
		Handler: handler,
		Method:  method,
	}
}

//Started start monitoring the app
func (h *HTTP) Started() {
	h.StartedAt = time.Now()
}

// Finished app finished
func (h *HTTP) Finished() {
	h.FinishedAt = time.Now()
	h.Duration = time.Since(h.StartedAt).Seconds()
}

//UseCase definition
type UseCase interface {
	SaveCLI(c *CLI) error
	SaveHTTP(h *HTTP)
}
In this file we define two important structures, CLI and HTTP, which are the data we want to collect from our command line applications and our API. We also defined the UseCase interface, which we will implement later, and functions that initialize the structures: NewCLI and NewHTTP. As I mentioned in previous posts, this Clean Architecture tactic allows us to abstract the details of the metrics collection to the other layers of the application. If at any point we change Prometheus’ metric collection solution to any other, we will have no problems, as the other layers expect to receive something that implements the UseCase interface.
We will now implement the interface, creating the file pkg/metric/prometheus.go:
package metric

import (
	"github.com/prometheus/client_golang/prometheus"
	"github.com/prometheus/client_golang/prometheus/push"
	"github.com/eminetto/clean-architecture-go/config"
)

//Service implements UseCase interface
type Service struct {
	pHistogram           *prometheus.HistogramVec
	httpRequestHistogram *prometheus.HistogramVec
}

//NewPrometheusService create a new prometheus service
func NewPrometheusService() (*Service, error) {
	cli := prometheus.NewHistogramVec(prometheus.HistogramOpts{
		Namespace: "pushgateway",
		Name:      "cmd_duration_seconds",
		Help:      "CLI application execution in seconds",
		Buckets:   prometheus.DefBuckets,
	}, []string{"name"})
	http := prometheus.NewHistogramVec(prometheus.HistogramOpts{
		Namespace: "http",
		Name:      "request_duration_seconds",
		Help:      "The latency of the HTTP requests.",
		Buckets:   prometheus.DefBuckets,
	}, []string{"handler", "method", "code"})

	s := &Service{
		pHistogram:           cli,
		httpRequestHistogram: http,
	}
	err := prometheus.Register(s.pHistogram)
	if err != nil && err.Error() != "duplicate metrics collector registration attempted" {
		return nil, err
	}
	err = prometheus.Register(s.httpRequestHistogram)
	if err != nil && err.Error() != "duplicate metrics collector registration attempted" {
		return nil, err
	}
	return s, nil
}

//SaveCLI send metrics to server
func (s *Service) SaveCLI(c *CLI) error {
	gatewayURL := config.PROMETHEUS_PUSHGATEWAY
	s.pHistogram.WithLabelValues(c.Name).Observe(c.Duration)
	return push.New(gatewayURL, "cmd_job").Collector(s.pHistogram).Push()
}

//SaveHTTP send metrics to server
func (s *Service) SaveHTTP(h *HTTP) {
	s.httpRequestHistogram.WithLabelValues(h.Handler, h.Method, h.StatusCode).Observe(h.Duration)
}
In this file, using the NewPrometheusService function, we have an implementation of the UseCase interface, which we will use in the next steps. We can find the details of each function used in the documentation of the official Go client.
Another important point of this file is the line gatewayURL: = config.PROMETHEUS_PUSHGATEWAY which is inside the function SaveCLI. Prometheus works as a metric collector, so we need to have a way to store the data in memory, until it does the collection. When we are talking about an application that keeps running, such as an API, this data remains in memory. But with a CLI application, which quits after execution, we have to store this data somewhere. The Prometheus project has a solution for this, the PushGateway. It is a small application that we must run on some server and that will store the data until Prometheus collect it. I will talk about PushGateway again when we configure the docker-compose.yml of the application. In this configuration, we have the address of the PushGateway. I included this variable in the files: config / config_testing.go, config / config_staging.go, config / config_prod.go and config / config_dev.go. Check out this [post to understand] (https://eltonminetto.dev/post/2018-06-25-golang-usando-build-tags/) the reason for the existence of these files. For example, the file config / config_dev.go contains:
// +build dev

package config

const (
	MONGODB_HOST            = "mongodb://127.0.0.1:27017"
	MONGODB_DATABASE        = "bookmark"
	MONGODB_CONNECTION_POOL = 5
	API_PORT                = 8080
	PROMETHEUS_PUSHGATEWAY = "http://localhost:9091/"
)
Collecting metrics from CLI applications
We will now start using the service to collect metrics from our CLI application. This is the new code of cmd/main.go file:
package main

import (
	"errors"
	"fmt"
	"github.com/eminetto/clean-architecture-go/pkg/metric"
	"log"
	"os"

	"github.com/eminetto/clean-architecture-go/config"
	"github.com/eminetto/clean-architecture-go/pkg/bookmark"
	"github.com/eminetto/clean-architecture-go/pkg/entity"
	"github.com/juju/mgosession"
	mgo "gopkg.in/mgo.v2"
)

func handleParams() (string, error) {
	if len(os.Args) < 2 {
		return "", errors.New("Invalid query")
	}
	return os.Args[1], nil
}

func main() {
	metricService, err := metric.NewPrometheusService()
	if err != nil {
		log.Fatal(err.Error())
	}
	appMetric := metric.NewCLI("search")
	appMetric.Started()
	query, err := handleParams()
	if err != nil {
		log.Fatal(err.Error())
	}

	session, err := mgo.Dial(config.MONGODB_HOST)
	if err != nil {
		log.Fatal(err.Error())
	}
	defer session.Close()

	mPool := mgosession.NewPool(nil, session, config.MONGODB_CONNECTION_POOL)
	defer mPool.Close()

	bookmarkRepo := bookmark.NewMongoRepository(mPool, config.MONGODB_DATABASE)
	bookmarkService := bookmark.NewService(bookmarkRepo)
	all, err := bookmarkService.Search(query)
	if err != nil {
		log.Fatal(err)
	}
	if len(all) == 0 {
		log.Fatal(entity.ErrNotFound.Error())
	}
	for _, j := range all {
		fmt.Printf("%s %s %v \n", j.Name, j.Link, j.Tags)
	}
	appMetric.Finished()
	err = metricService.SaveCLI(appMetric)
	if err != nil {
		log.Fatal(err)
	}
}
At the beginning of the main function, we create the service with the implementation for Prometheus:
metricService, err := metric.NewPrometheusService()
if err != nil {
	log.Fatal(err.Error())
}
After that, we started the data collecting, giving a name to our application, which we will use in the visualization in Grafana:
appMetric := metric.NewCLI("search")
appMetric.Started()
And at the end of the file, we complete the collection and send the data to the PushGateway:
appMetric.Finished()
err = metricService.SaveCLI(appMetric)
if err != nil {
	log.Fatal(err)
}
Collecting API metrics
Now let’s collect our API metrics. As we want to collect metrics from all endpoints, we can make use of the concept of middlewares. So, we will create the file pkg/middleware/metrics.go:
package middleware

import (
	"net/http"
	"strconv"

	"github.com/eminetto/clean-architecture-go/pkg/metric"

	"github.com/codegangsta/negroni"
)

//Metrics to prometheus
func Metrics(mService metric.UseCase) negroni.HandlerFunc {
   return func(w http.ResponseWriter, r *http.Request, next http.HandlerFunc) {
      appMetric := metric.NewHTTP(r.URL.Path, r.Method)
      appMetric.Started()
      next(w, r)
      res := w.(negroni.ResponseWriter)
      appMetric.Finished()
      appMetric.StatusCode = strconv.Itoa(res.Status())
      mService.SaveHTTP(appMetric)
   }
}
This middleware will receive an implementation of the metric. UseCase interface, start the collection of the request details (execution time and status code) and save the data for future collection. As we are talking about an API, it does this storage in memory, until Prometheus collects and processes it.
We now need to change the main.go of our API, to make use of the new middleware and to create the endpoint that Prometheus will use to collect the metrics. I changed file api/main.go to this:
package main

import (
   "github.com/prometheus/client_golang/prometheus/promhttp"
   "log"
   "net/http"
   "os"
   "strconv"
   "time"

   "github.com/codegangsta/negroni"
   "github.com/eminetto/clean-architecture-go/api/handler"
   "github.com/eminetto/clean-architecture-go/config"
   "github.com/eminetto/clean-architecture-go/pkg/bookmark"
   "github.com/eminetto/clean-architecture-go/pkg/middleware"
   "github.com/eminetto/clean-architecture-go/pkg/metric"
   "github.com/gorilla/context"
   "github.com/gorilla/mux"
   "github.com/juju/mgosession"
   mgo "gopkg.in/mgo.v2"
)

func main() {
   session, err := mgo.Dial(config.MONGODB_HOST)
   if err != nil {
      log.Fatal(err.Error())
   }
   defer session.Close()

   r := mux.NewRouter()

   mPool := mgosession.NewPool(nil, session, config.MONGODB_CONNECTION_POOL)
   defer mPool.Close()

   bookmarkRepo := bookmark.NewMongoRepository(mPool, config.MONGODB_DATABASE)
   bookmarkService := bookmark.NewService(bookmarkRepo)

   metricService, err := metric.NewPrometheusService()
   if err != nil {
      log.Fatal(err.Error())
   }

   //handlers
   n := negroni.New(
      negroni.HandlerFunc(middleware.Cors),
      negroni.HandlerFunc(middleware.Metrics(metricService)),
      negroni.NewLogger(),
   )
   //bookmark
   handler.MakeBookmarkHandlers(r, *n, bookmarkService)

   http.Handle("/", r)
   http.Handle("/metrics", promhttp.Handler())
   r.HandleFunc("/ping", func(w http.ResponseWriter, r *http.Request) {
      w.WriteHeader(http.StatusOK)
   })

   logger := log.New(os.Stderr, "logger: ", log.Lshortfile)
   srv := &http.Server{
      ReadTimeout:  5 * time.Second,
      WriteTimeout: 10 * time.Second,
      Addr:         ":" + strconv.Itoa(config.API_PORT),
      Handler:      context.ClearHandler(http.DefaultServeMux),
      ErrorLog:     logger,
   }
   err = srv.ListenAndServe()
   if err != nil {
      log.Fatal(err.Error())
   }
}
The first important change, besides the imports and service startup (as we did in the CLI), was the inclusion of our new middleware in the execution stack, in the lines:
n := negroni.New(
  negroni.HandlerFunc(middleware.Cors),
  negroni.HandlerFunc(middleware.Metrics(metricService)),
  negroni.NewLogger(),
)
And the second change was the creation of an endpoint that Prometheus will use to collect the data:
http.Handle("/metrics", promhttp.Handler())
This is all the changes we need to do in our application to generate the data that Prometheus will use. We will now set up a local environment to facilitate testing.
Adding Prometheus and Grafana to the development environment
As we are using Docker to manage our development environment, we will change the docker-compose.yml file to add the new dependencies. The changed file looks like this:
version: "3"
services:
  mongodb:
    image: mongo
    ports:
        - "27017:27017"
    container_name: bookmark-mongodb
    network_mode: "bridge"
  node:
    image: node:8-alpine
    network_mode: "bridge"
    volumes:
        - ./web:/web
        - /tmp:/tmp
  grafana:
    image: grafana/grafana
    ports:
      - "3000:3000"
    container_name: bookmark-grafana
    network_mode: "bridge"
    depends_on:
      - prometheus
      - prometheus-pushgateway
  prometheus:
    image: prom/prometheus
    ports:
      - 9090:9090
    command:
      - --config.file=/etc/prometheus/prometheus.yml
    volumes:
      - ./infra/prometheus/prometheus.yml:/etc/prometheus/prometheus.yml:ro
    container_name: bookmark-prometheus
    network_mode: "bridge"
  prometheus-pushgateway:
    image: prom/pushgateway
    container_name: bookmark-pushgateway
    expose:
      - 9091
    ports:
      - "9091:9091"
We added the settings for the grafana, prometheus and prometheus-pushgateway services. As you can see in the prometheus configuration, we also need to create a file with your settings. The infra/prometheus/prometheus.yml file created was:
# my global config
global:
  scrape_interval:     15s # Set the scrape interval to every 15 seconds. Default is every 1 minute.
  evaluation_interval: 15s # Evaluate rules every 15 seconds. The default is every 1 minute.

# Alertmanager configuration
alerting:
  alertmanagers:
  - static_configs:
    - targets:
      # - alertmanager:9093

# Load rules once and periodically evaluate them according to the global 'evaluation_interval'.
rule_files:

# A scrape configuration containing exactly one endpoint to scrape:
# Here it's Prometheus itself.
scrape_configs:
  - job_name: bookmark
    scrape_interval: 10s
    static_configs:
    - targets: ['host.docker.internal:8080']
  - job_name: pushgateway
    scrape_interval: 10s
    static_configs:
    - targets: ['host.docker.internal:9091']
We can see more details about Prometheus settings in the official documentation.
By running the docker-compose up -d command, we can see the services running:
docker-compose up -d
Starting bookmark-pushgateway         ... done
Starting bookmark-mongodb             ... done
Starting clean-architecture-go_node_1 ... done
Starting bookmark-prometheus          ... done
Starting bookmark-grafana             ... done
Configuring Grafana
We will now use Grafana to create visualizations of the data collected by Prometheus.
Accessing the link http://localhost:3000/login we will login with the user admin and the password admin (and generate a new password, as requested by the interface).
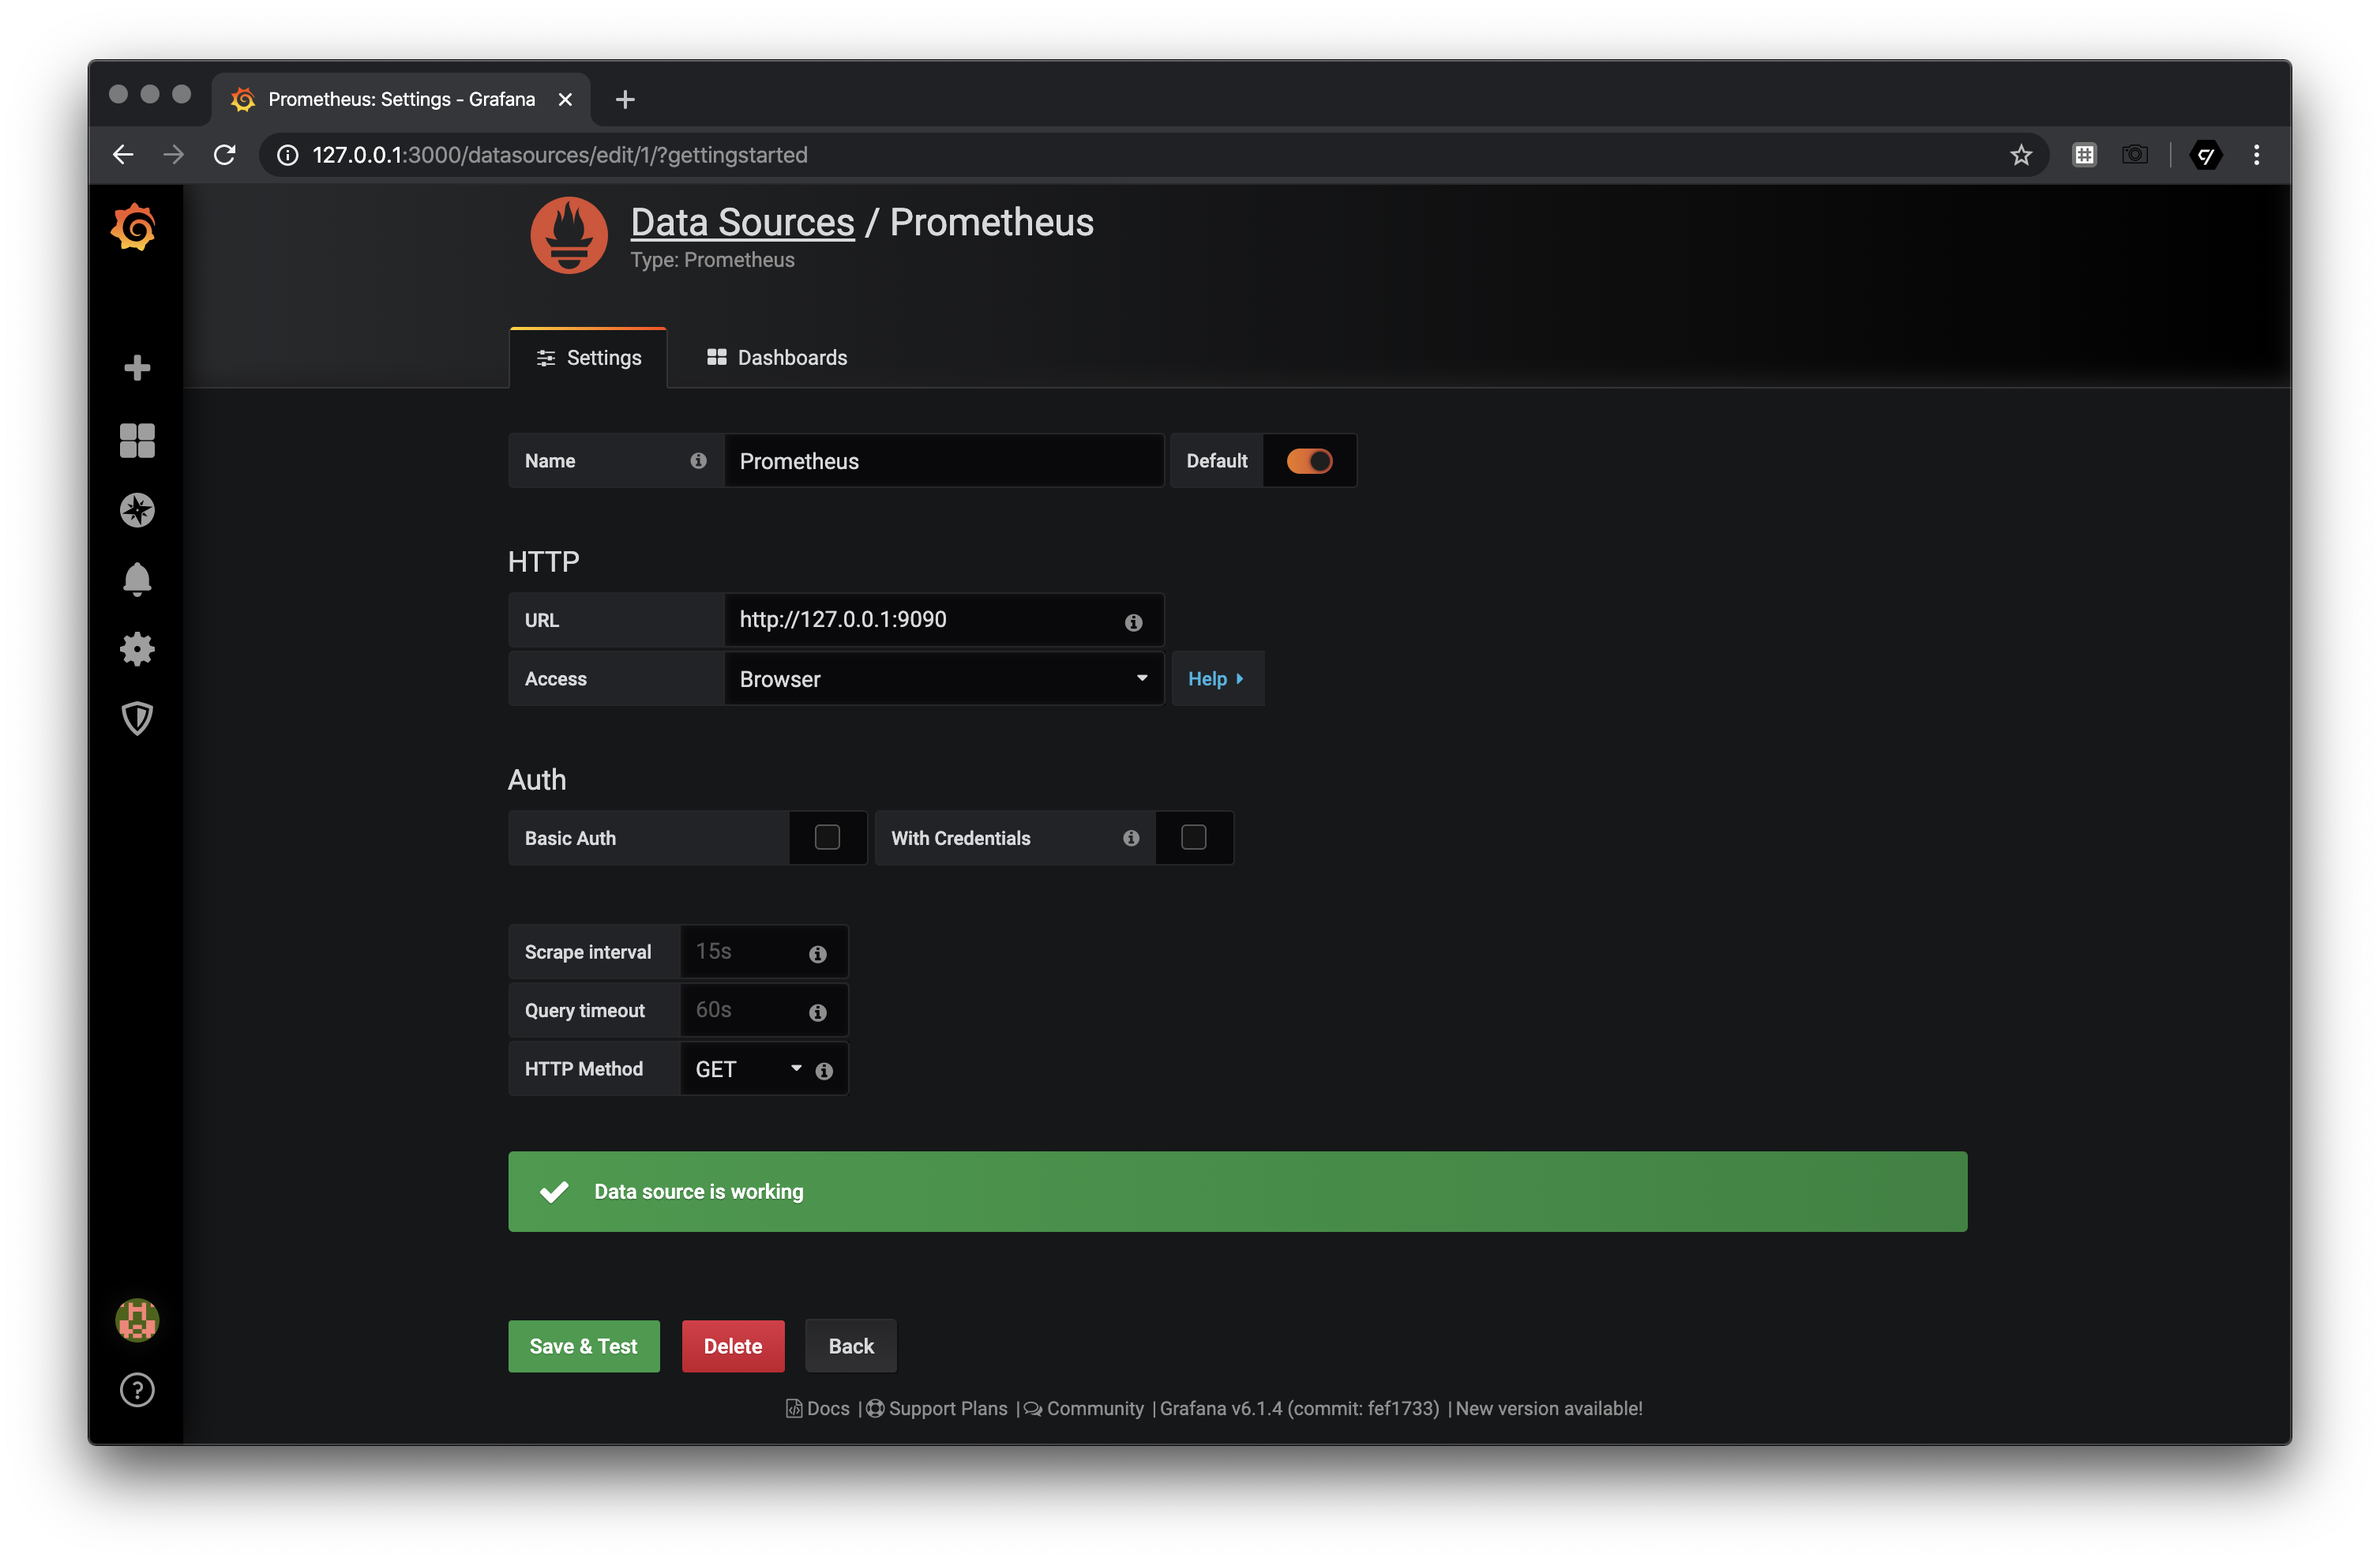
After login it is necessary to create a new data source, using the option in the interface. When selecting the Prometheus option, it is necessary to fill in the information:
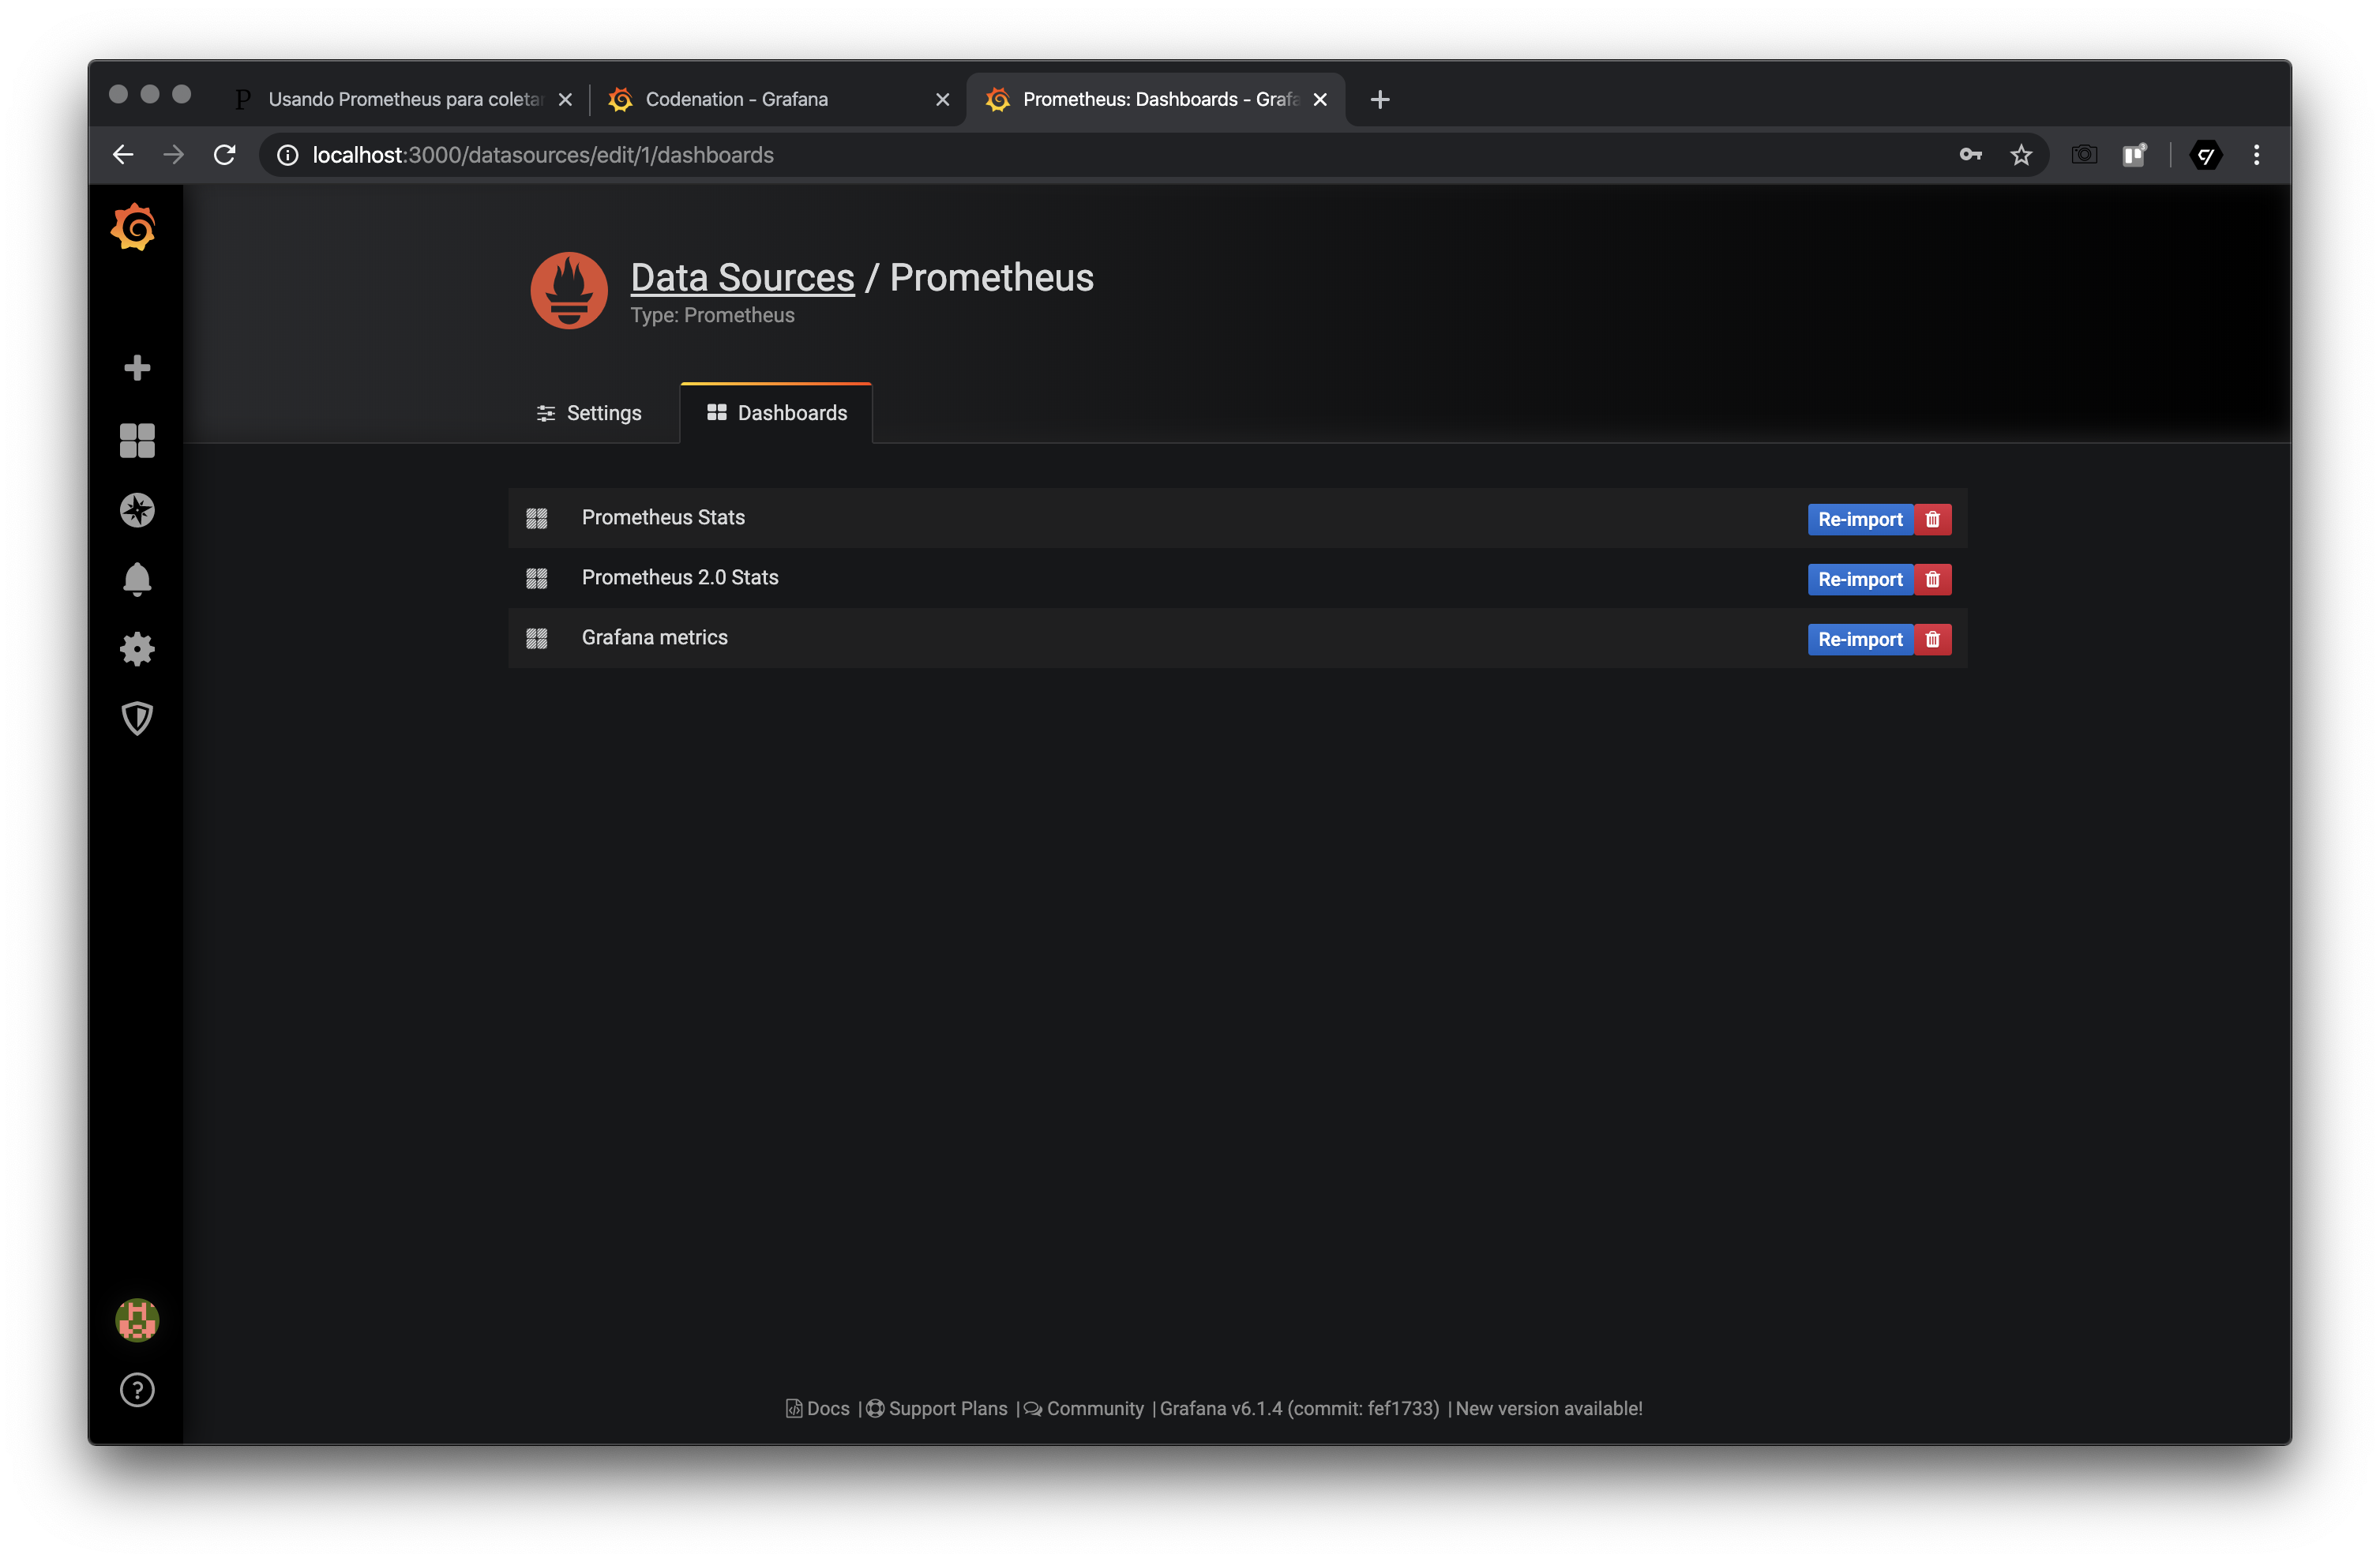
In the option Dashboards we need to import the standard dashboards:
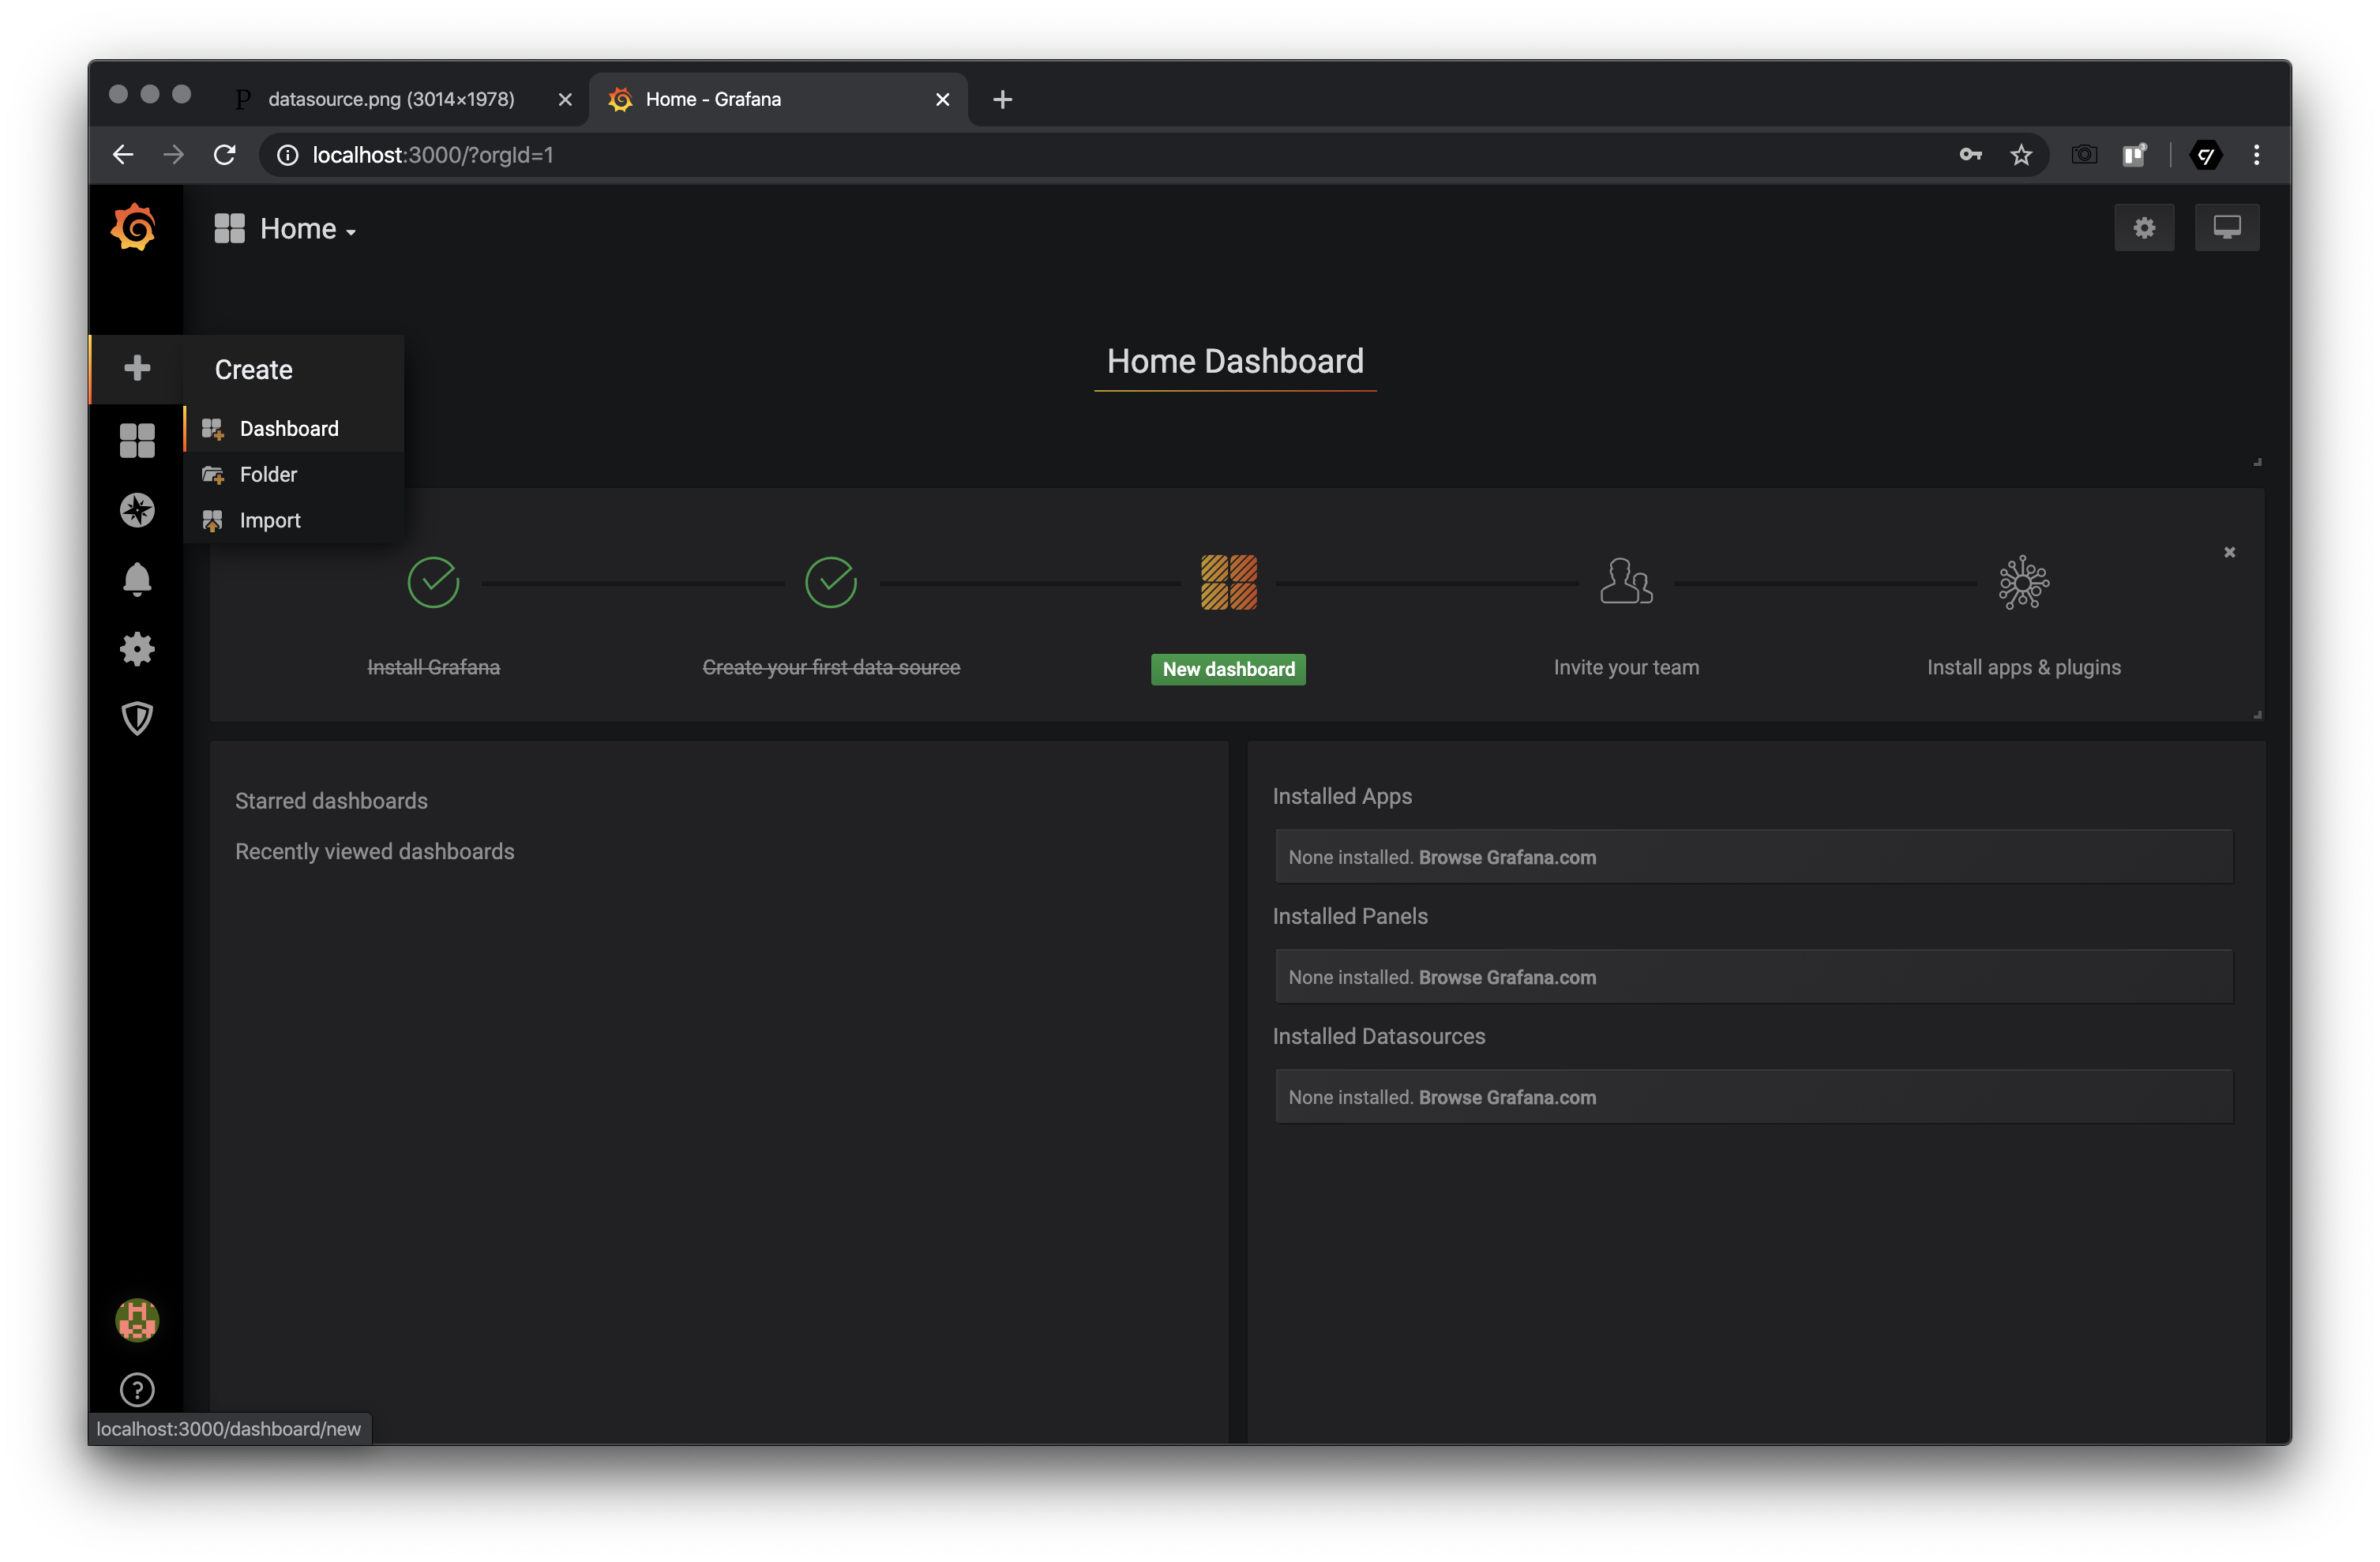
Now let’s create our first dashboard:
Selecting the option Add query we will fill with the data:
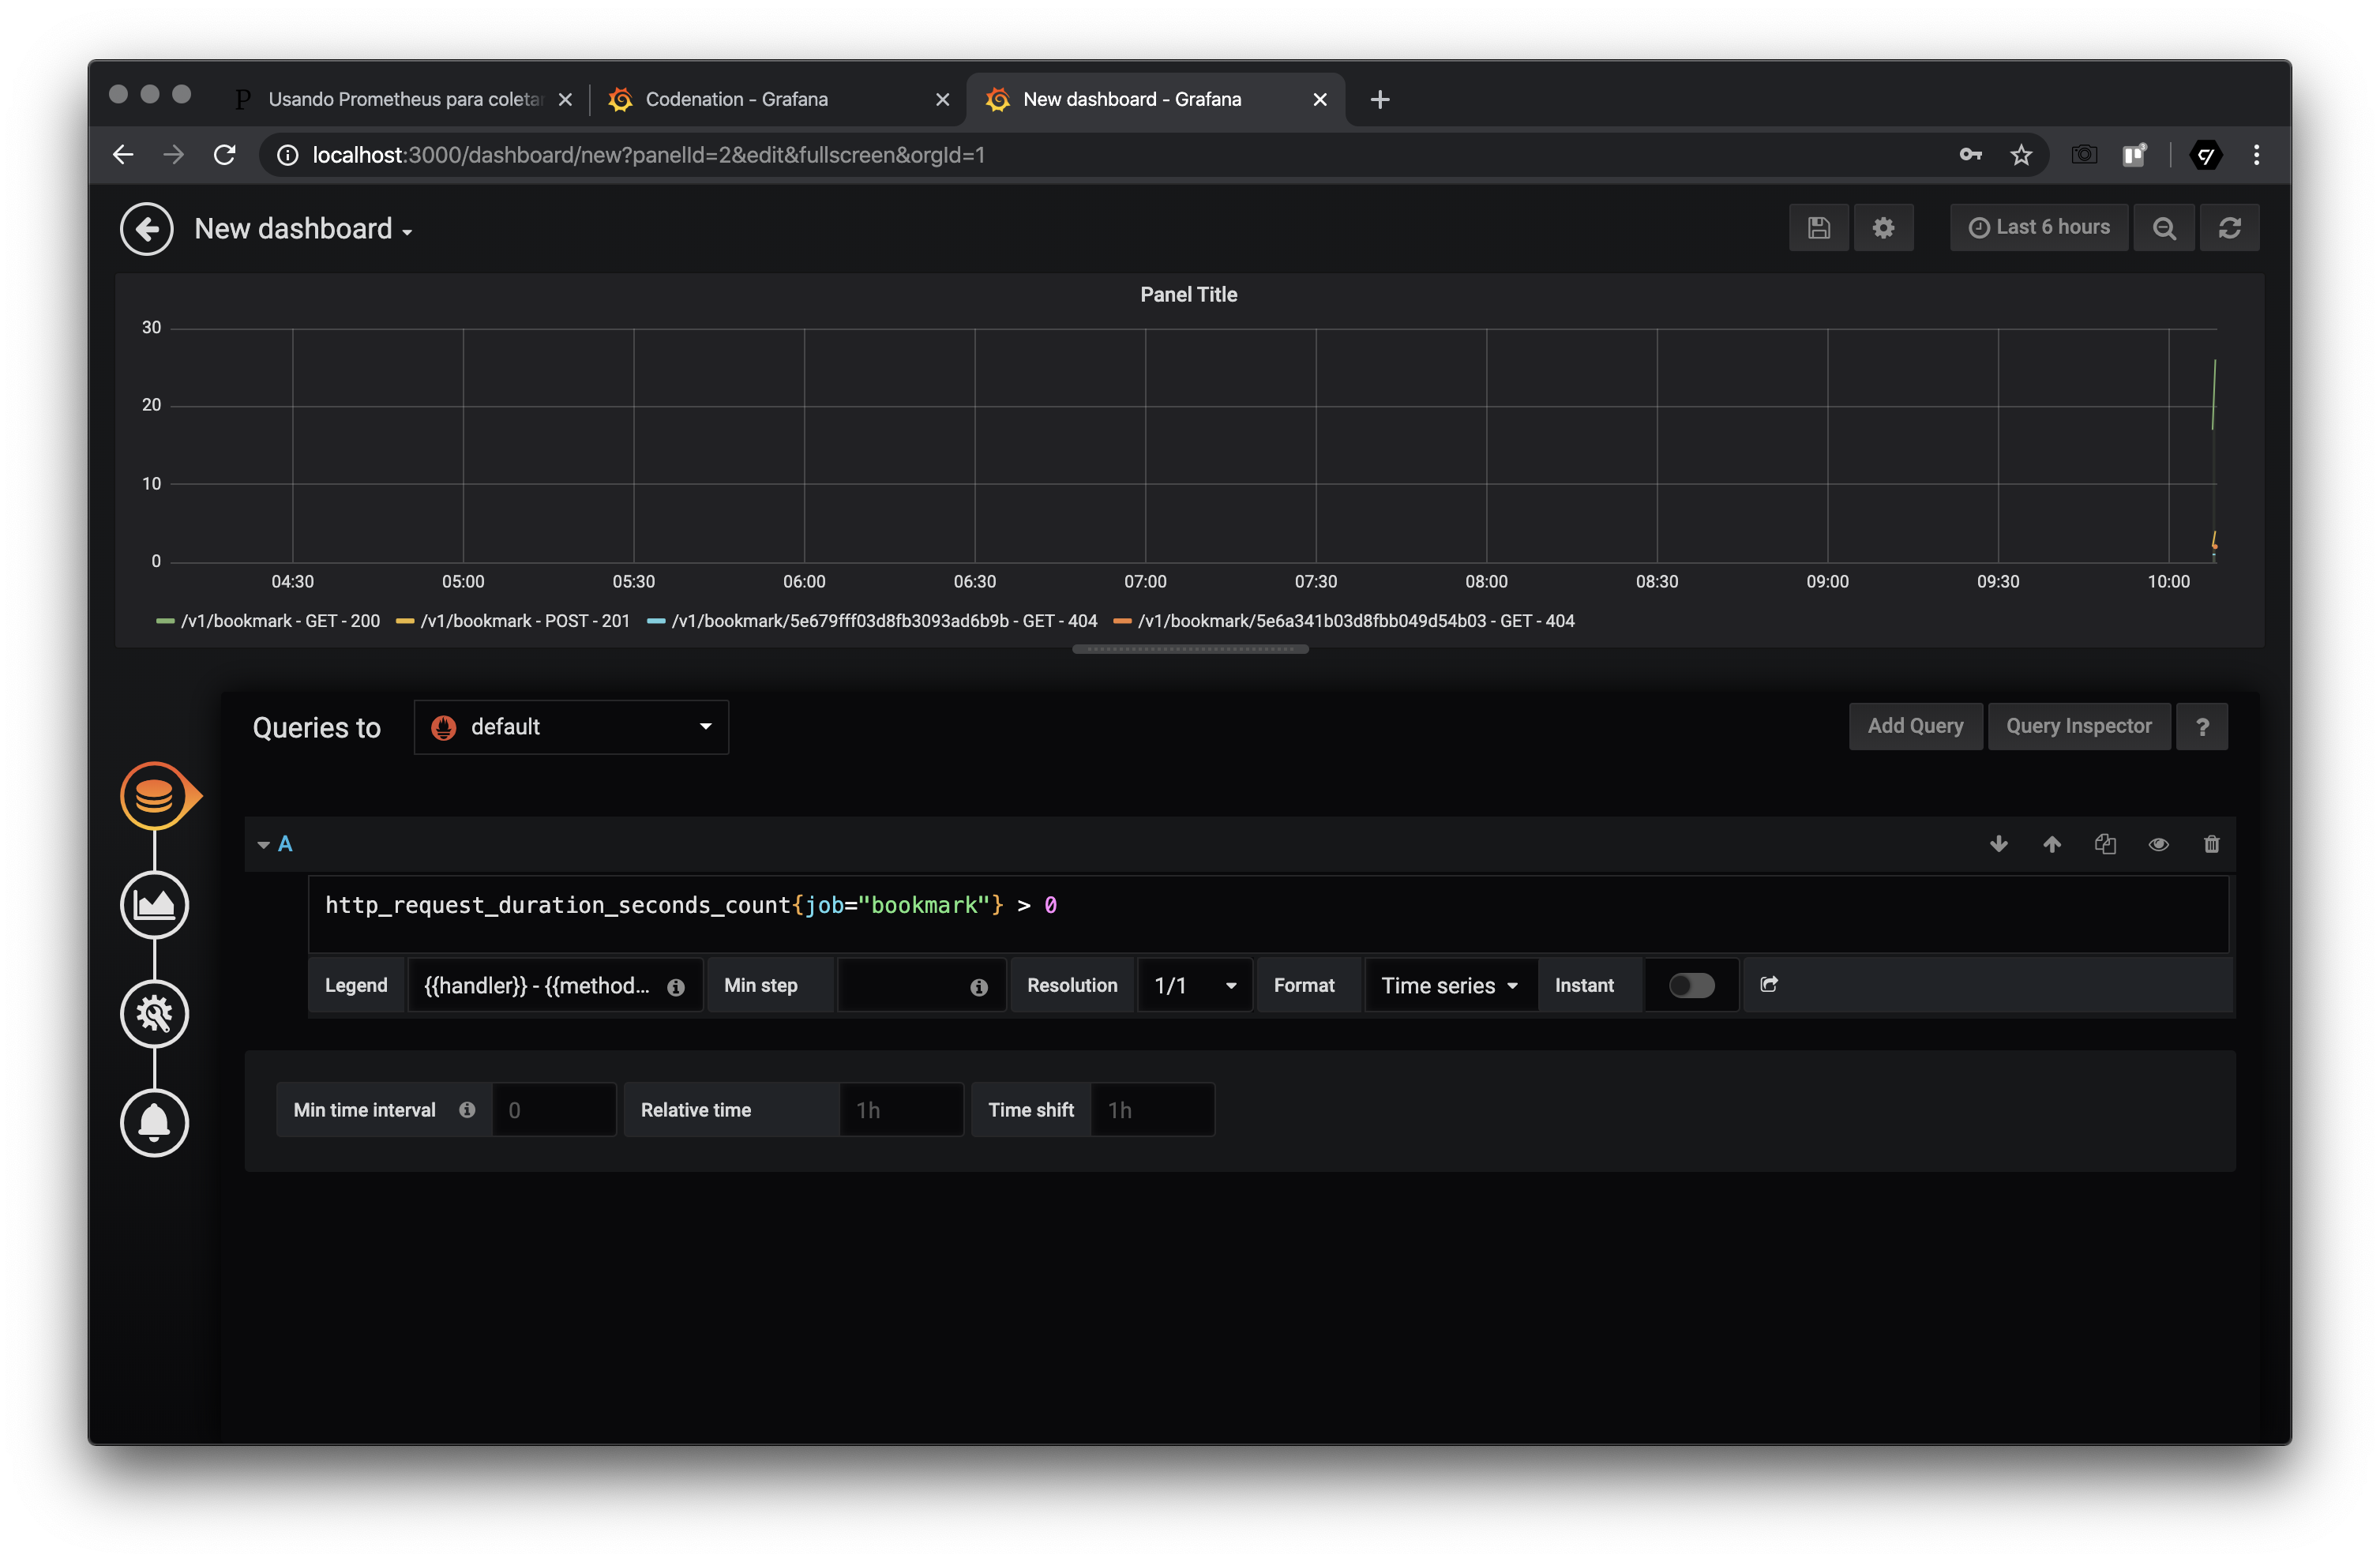
In the query field we use:
http_request_duration_seconds_count{job="bookmark"} > 0
And in the Legend field we put the information we want to show:
{{handler}} - {{method}} - {{code}}
In this way we will also see what is the method and status code, besides the URL accessed.
In the General option we will give a name for our visualization:
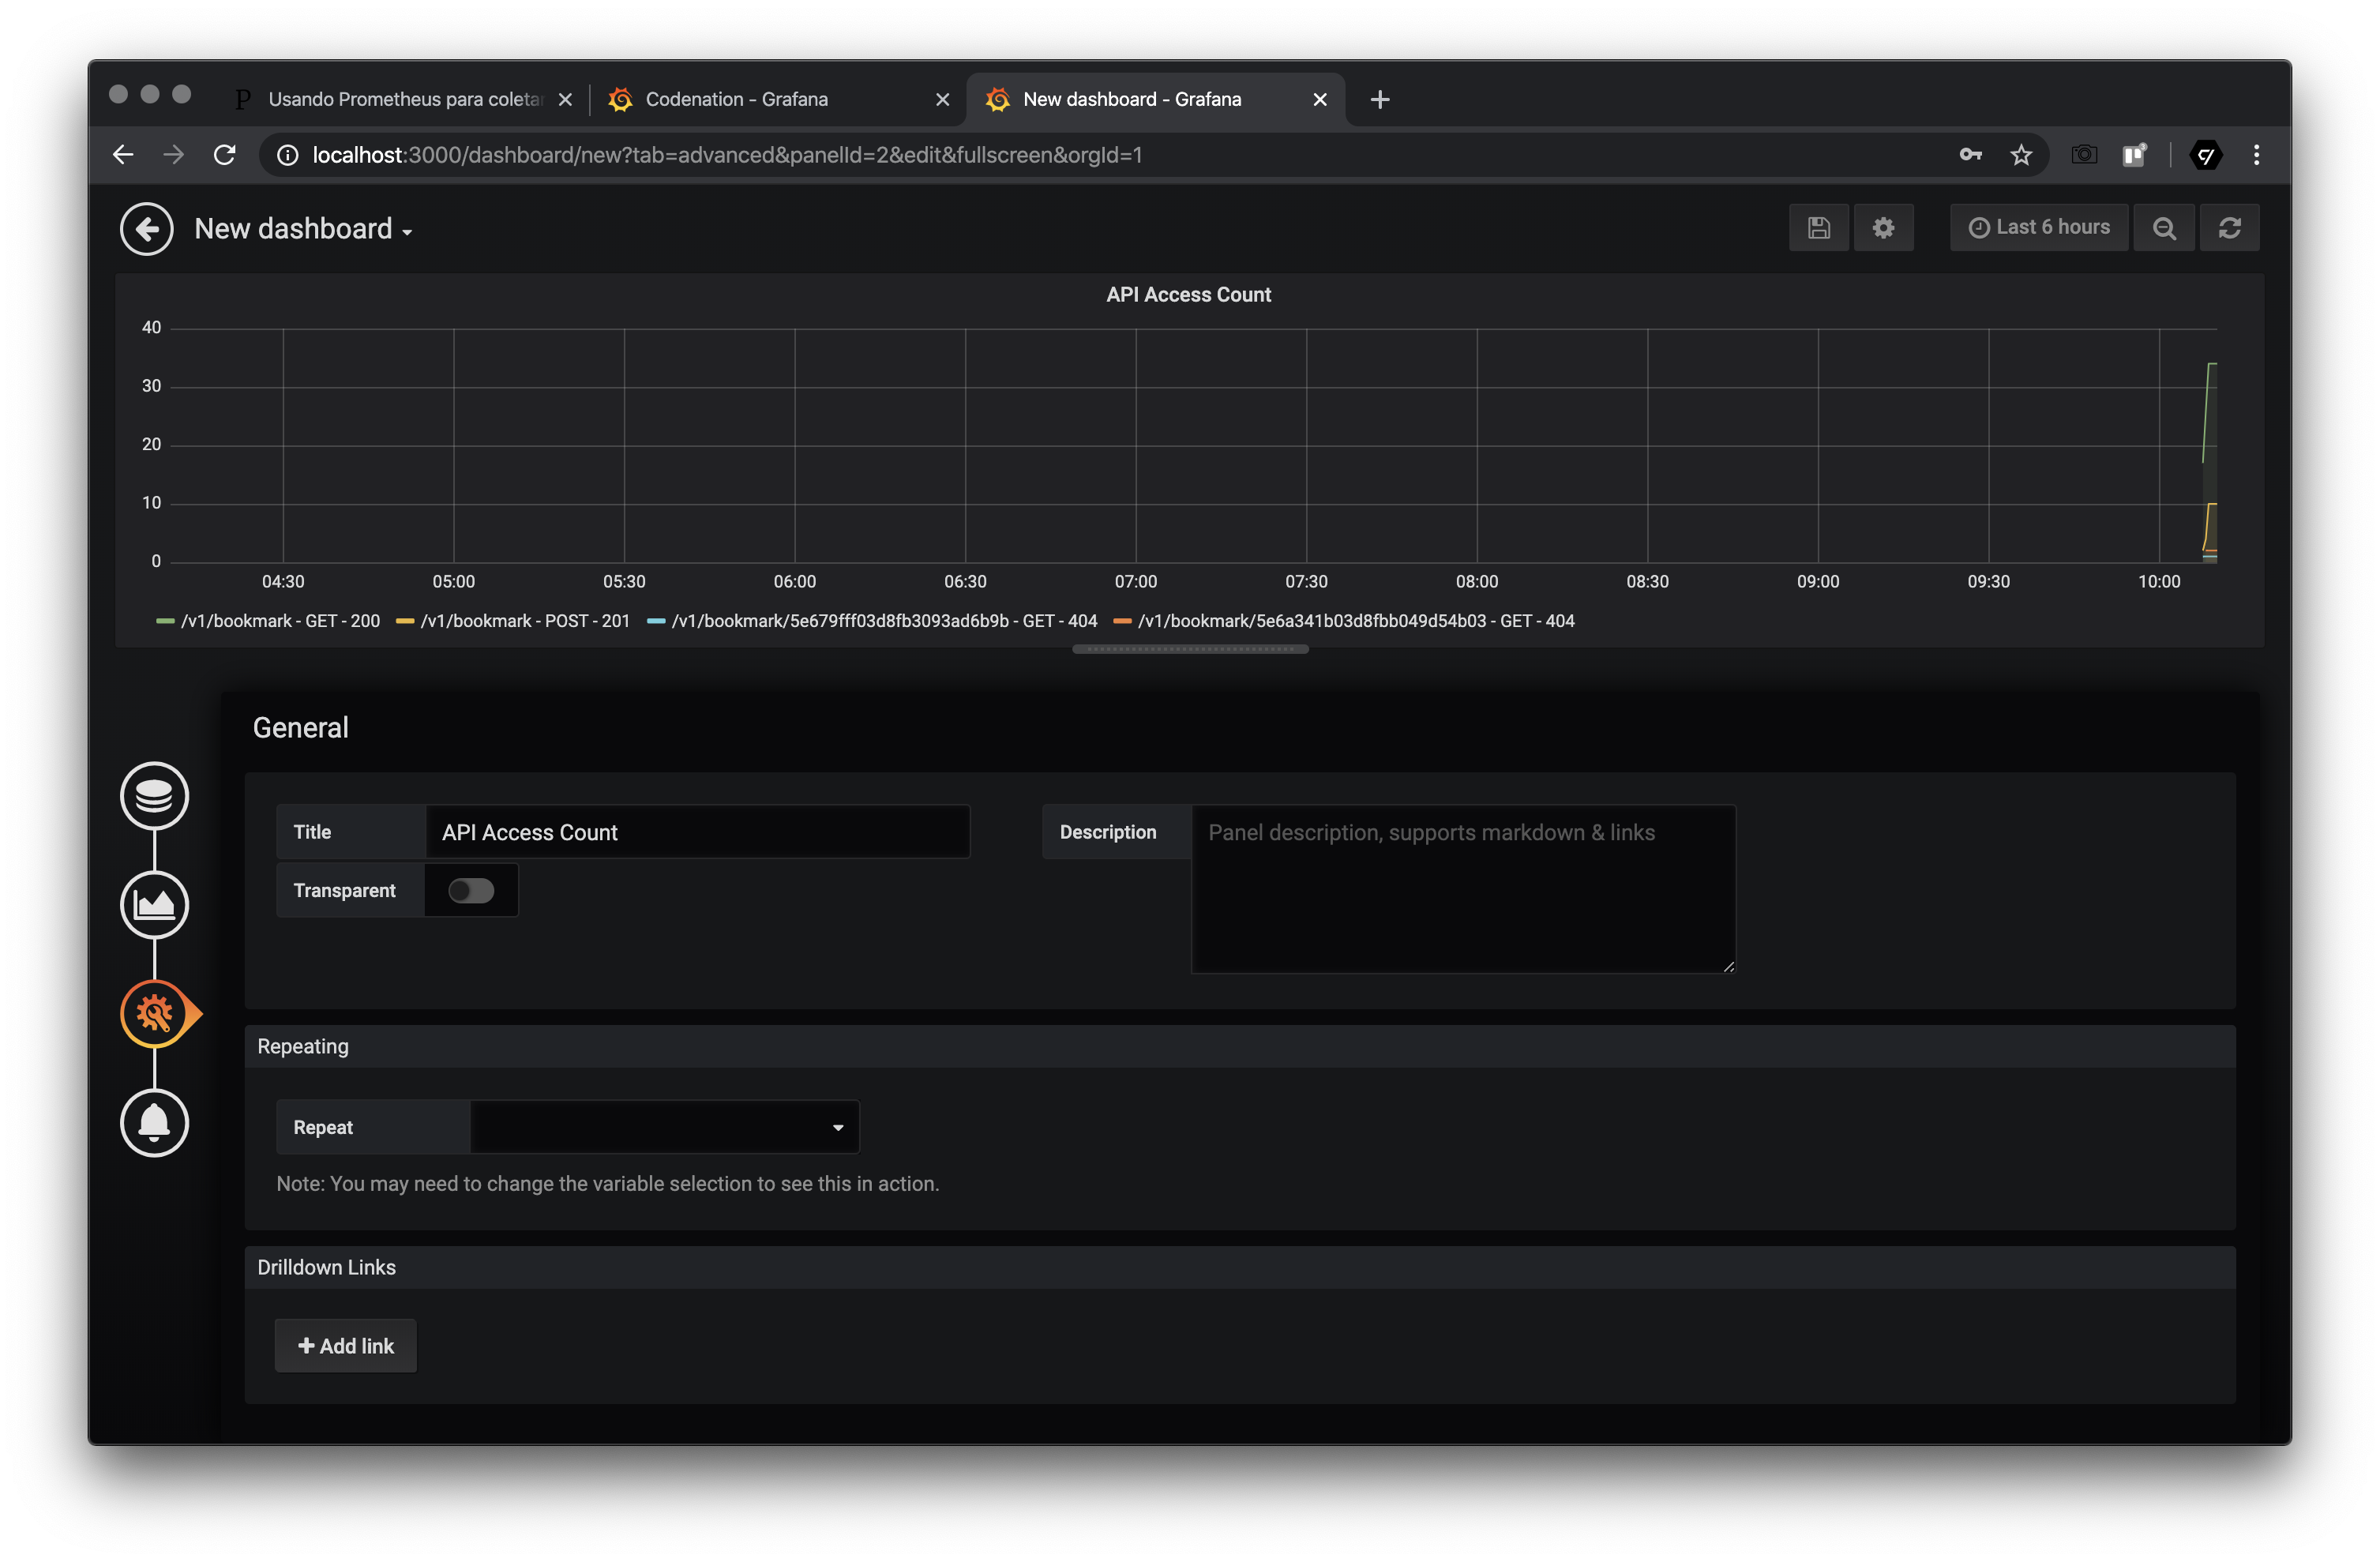
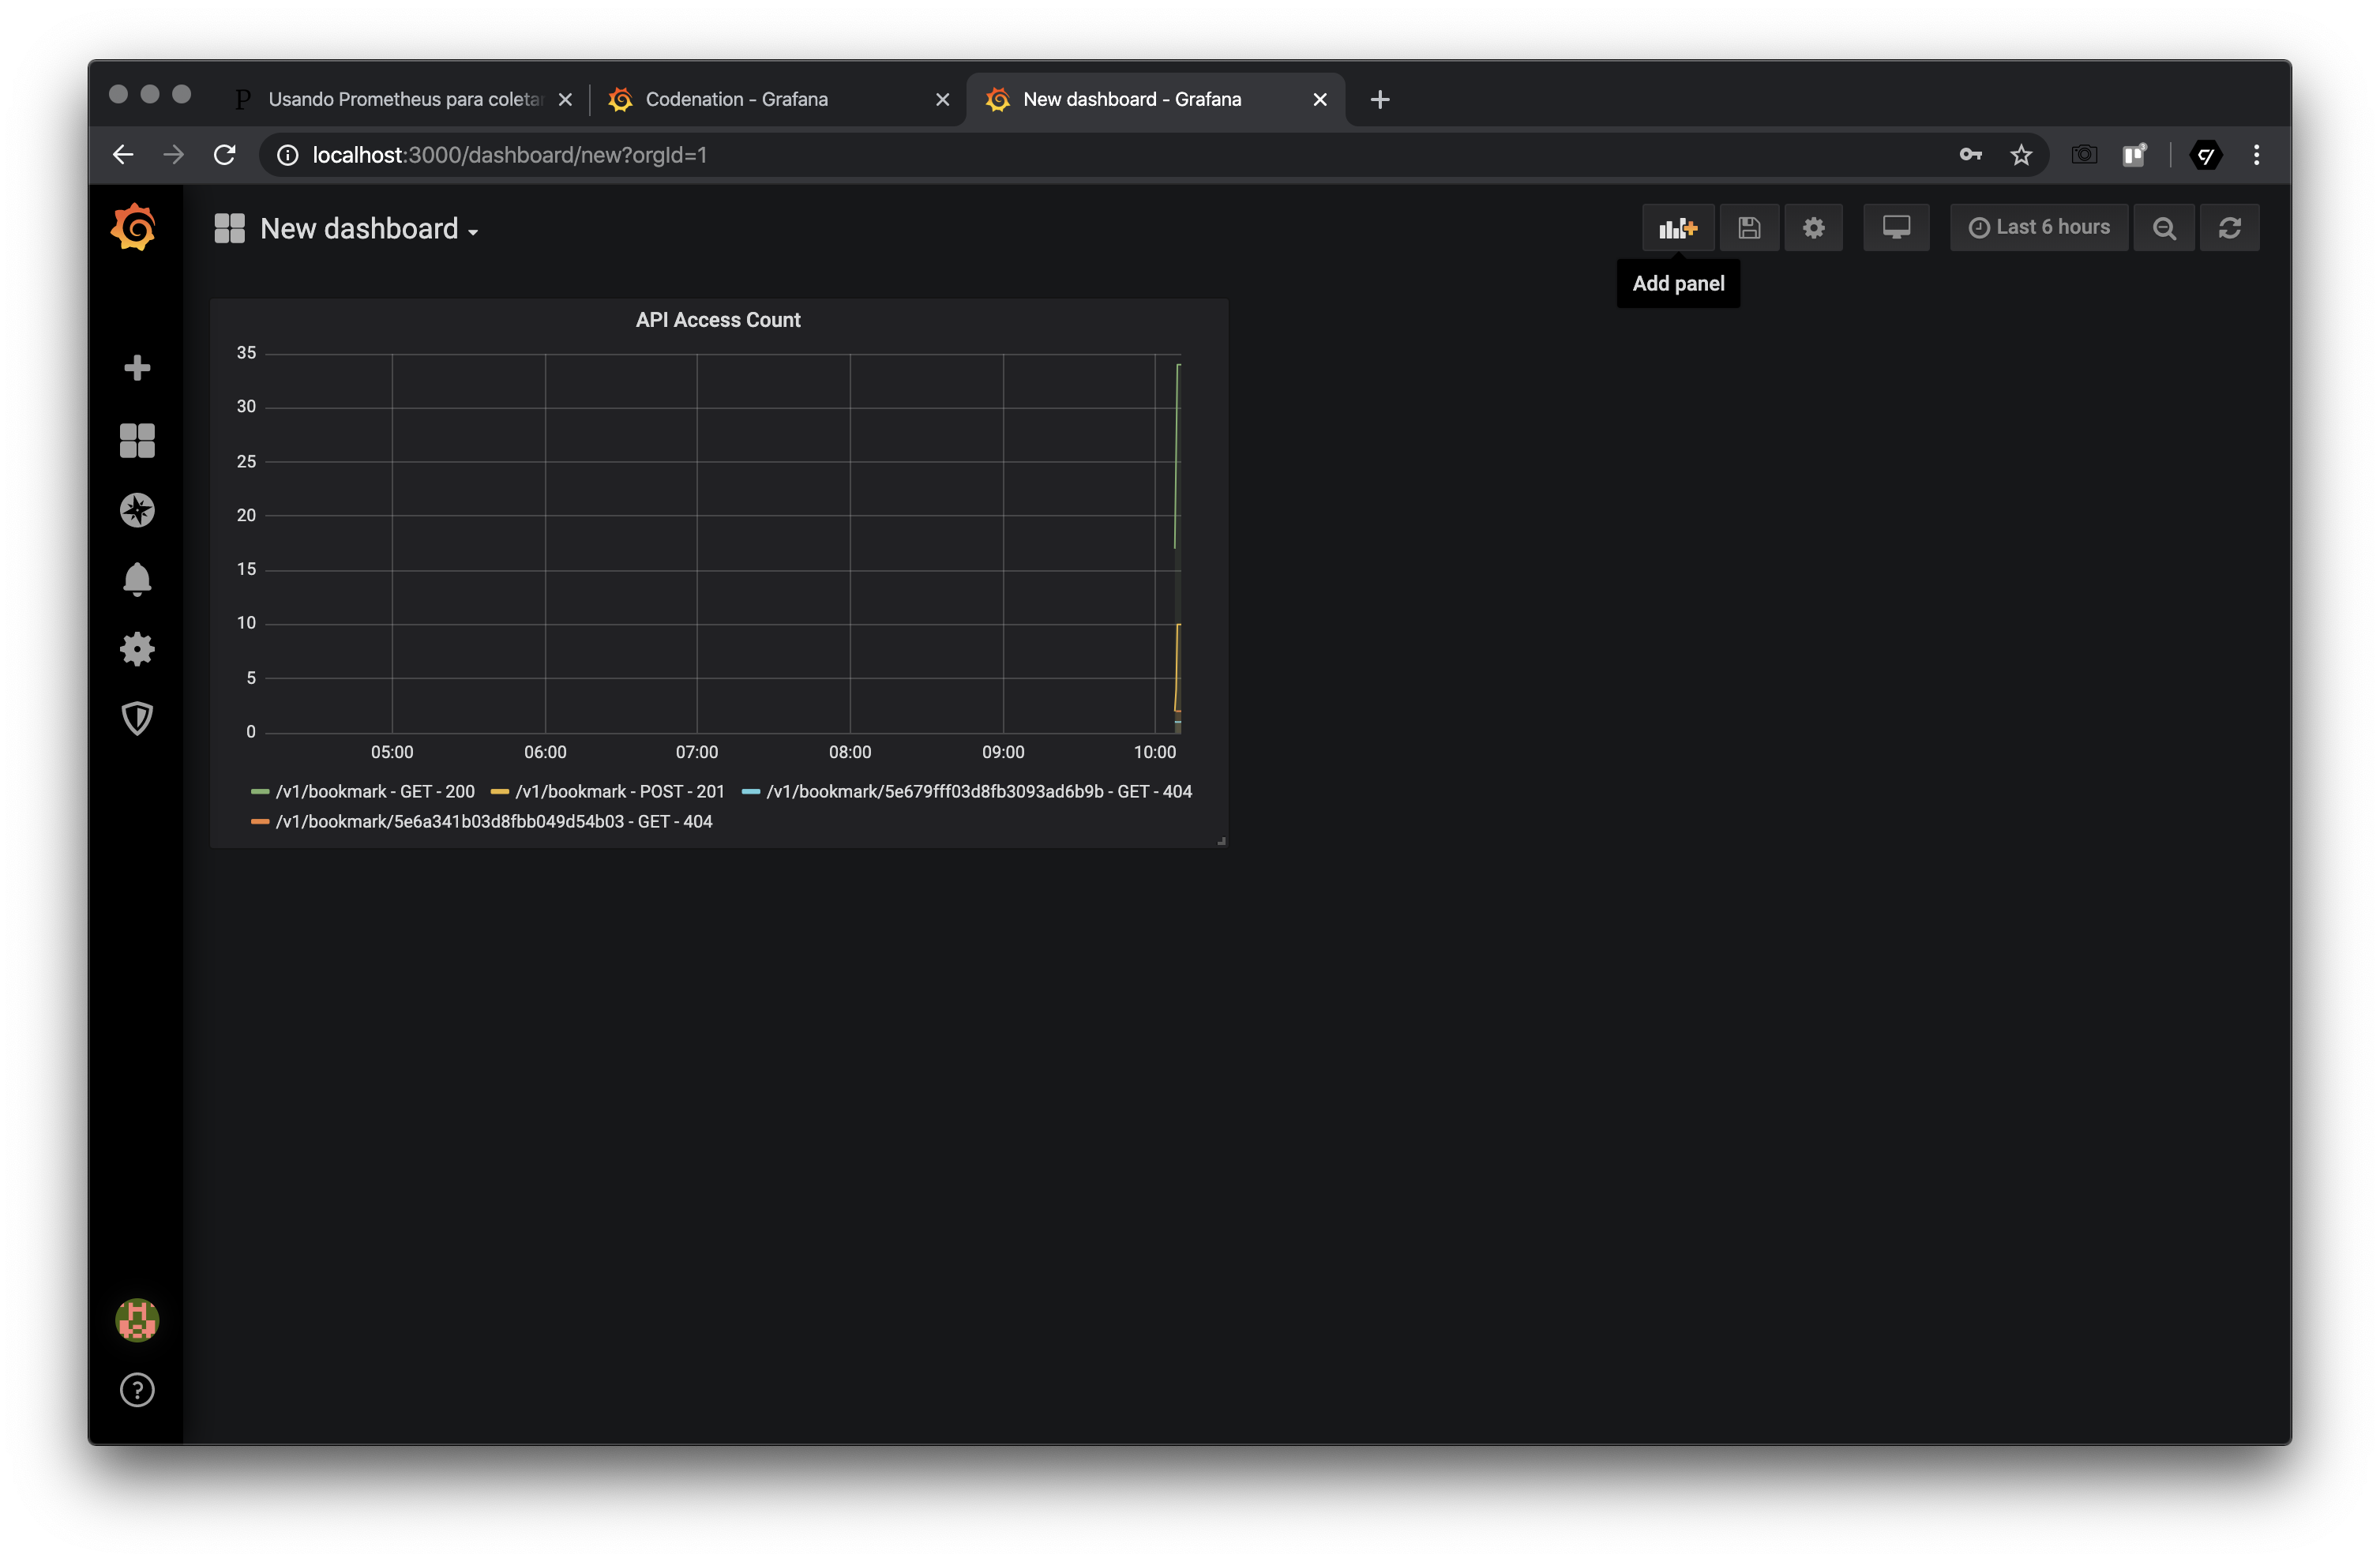
As we will not create alerts, we can click to go back (a button with an arrow, on the top of the page) to view our updated dashboard.
Now let’s add a new panel, with the information from our CLI:
And let’s create a new query:
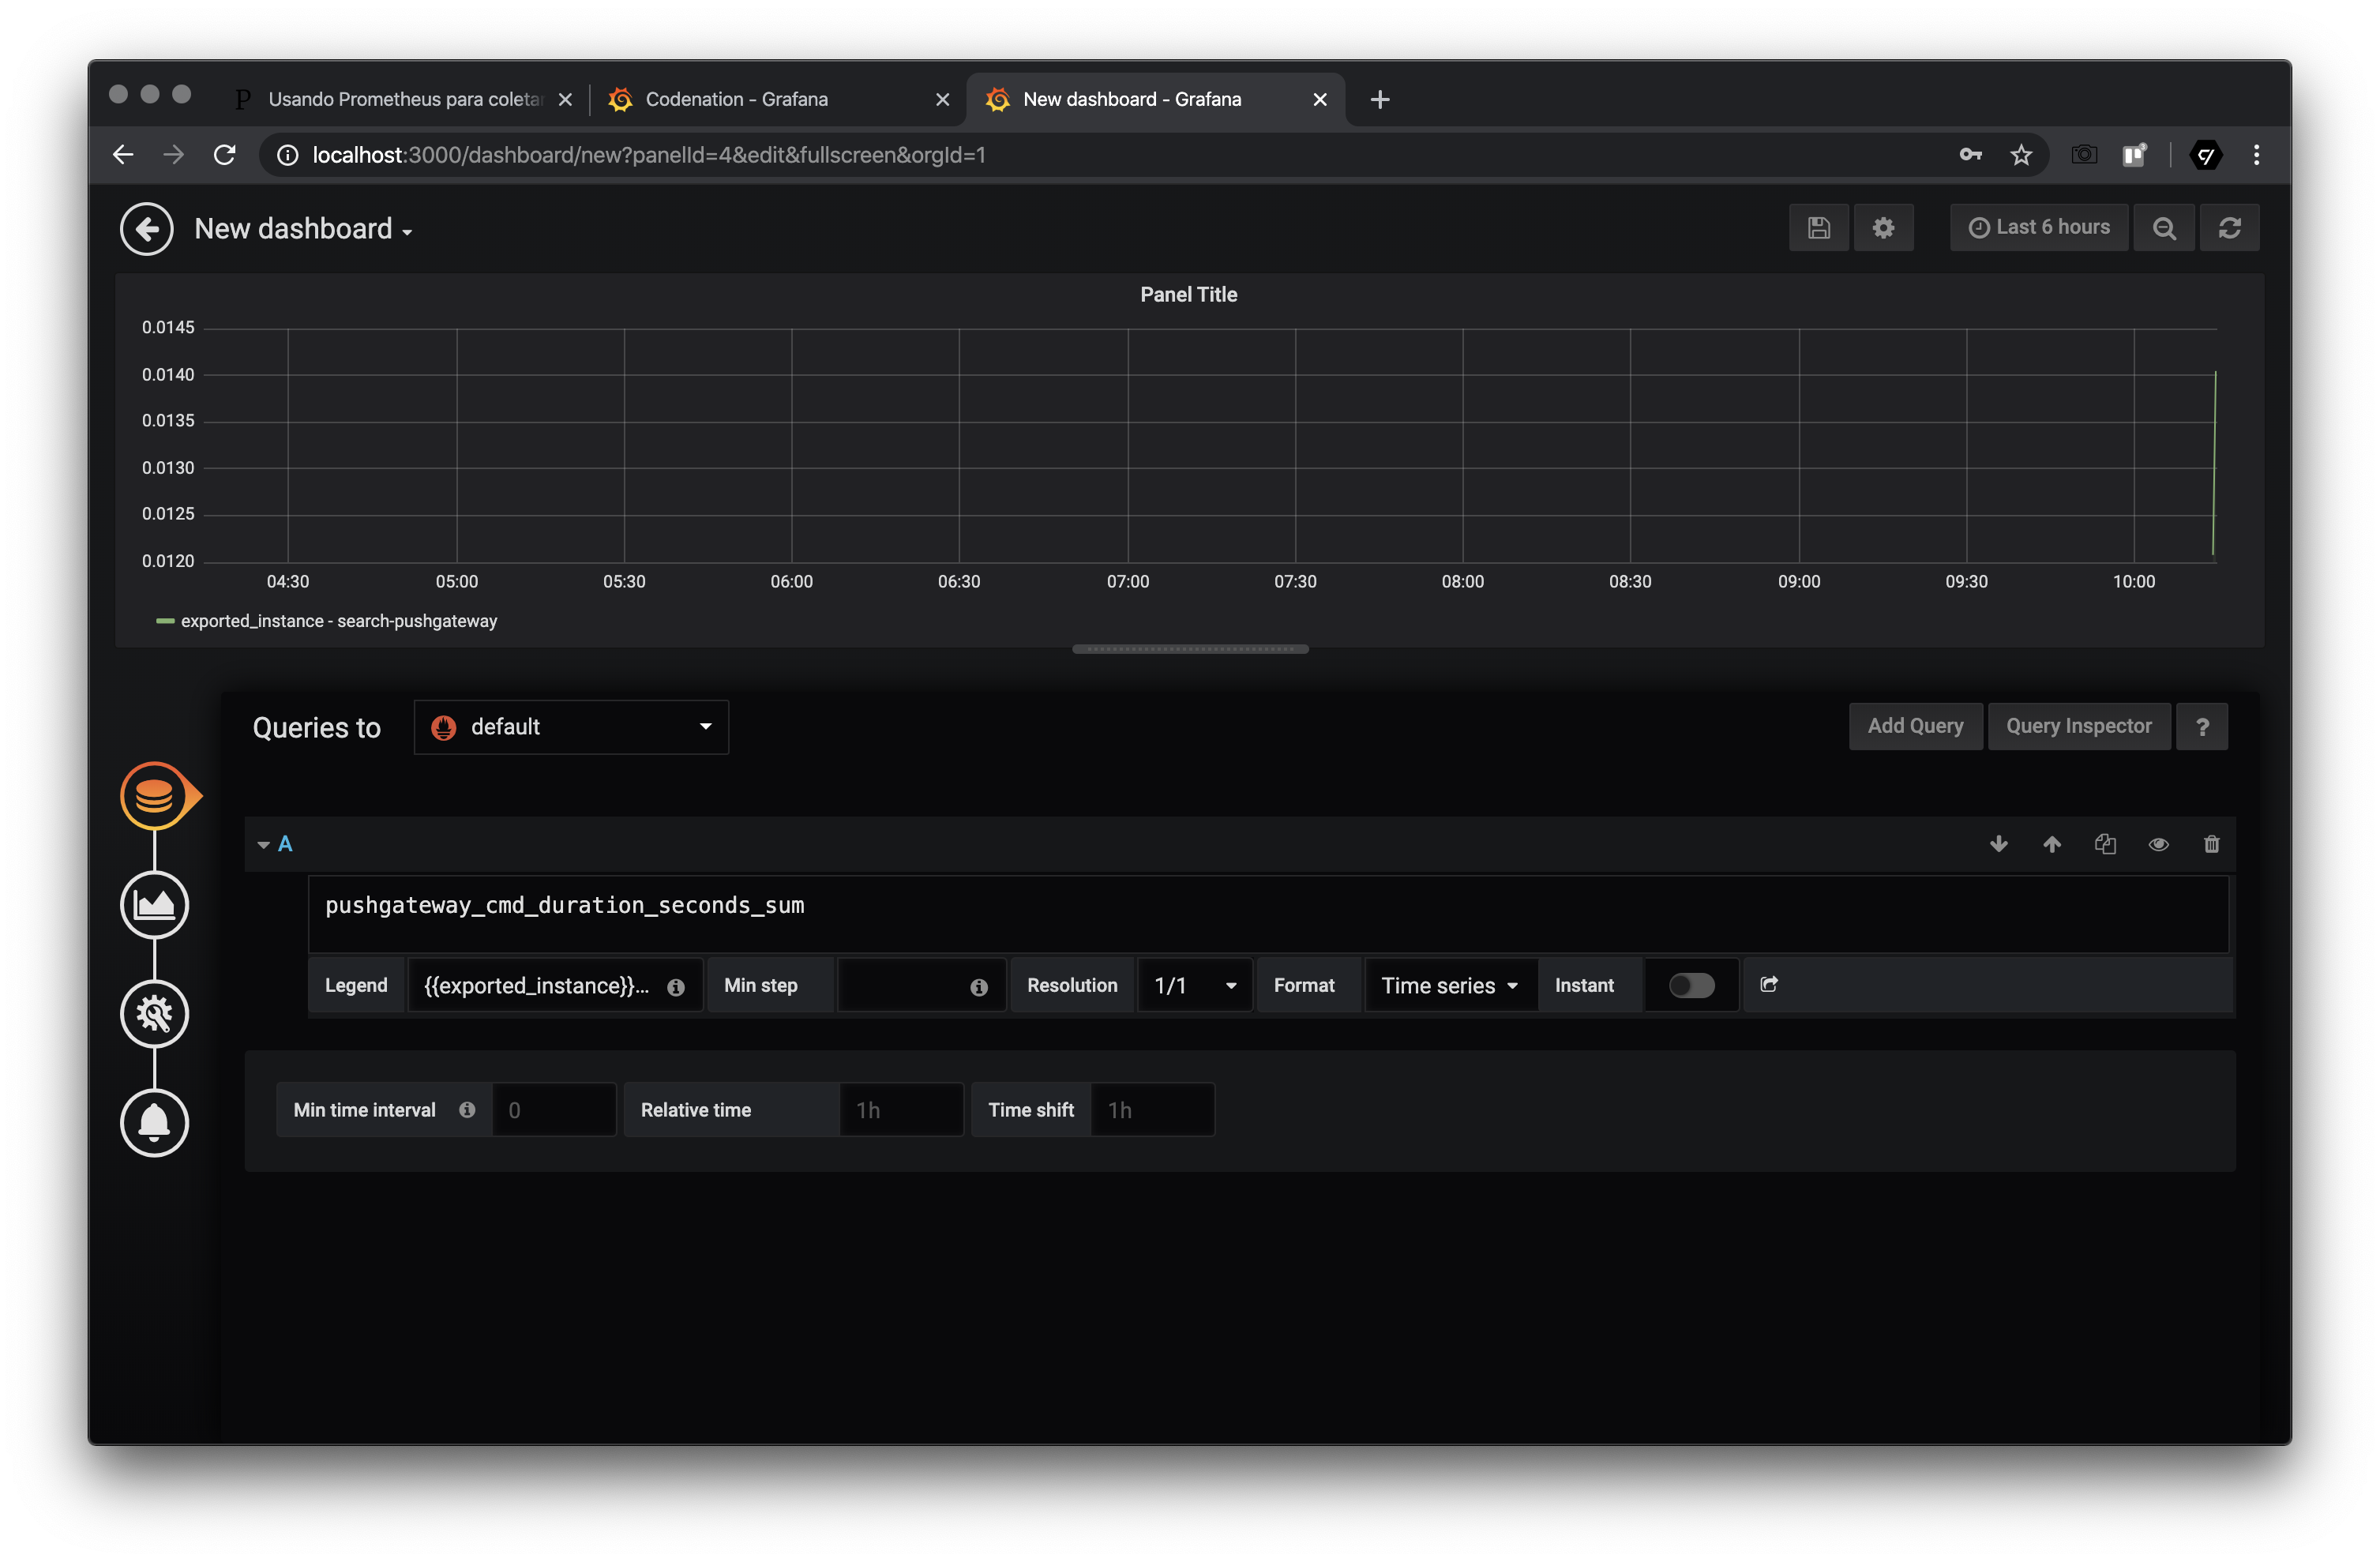
In the query we put the value:
pushgateway_cmd_duration_seconds_sum
And as a Legend we use:
{{name}}
We can give a name to our new panel, in the General option and return to the dashboard, which now looks like this:
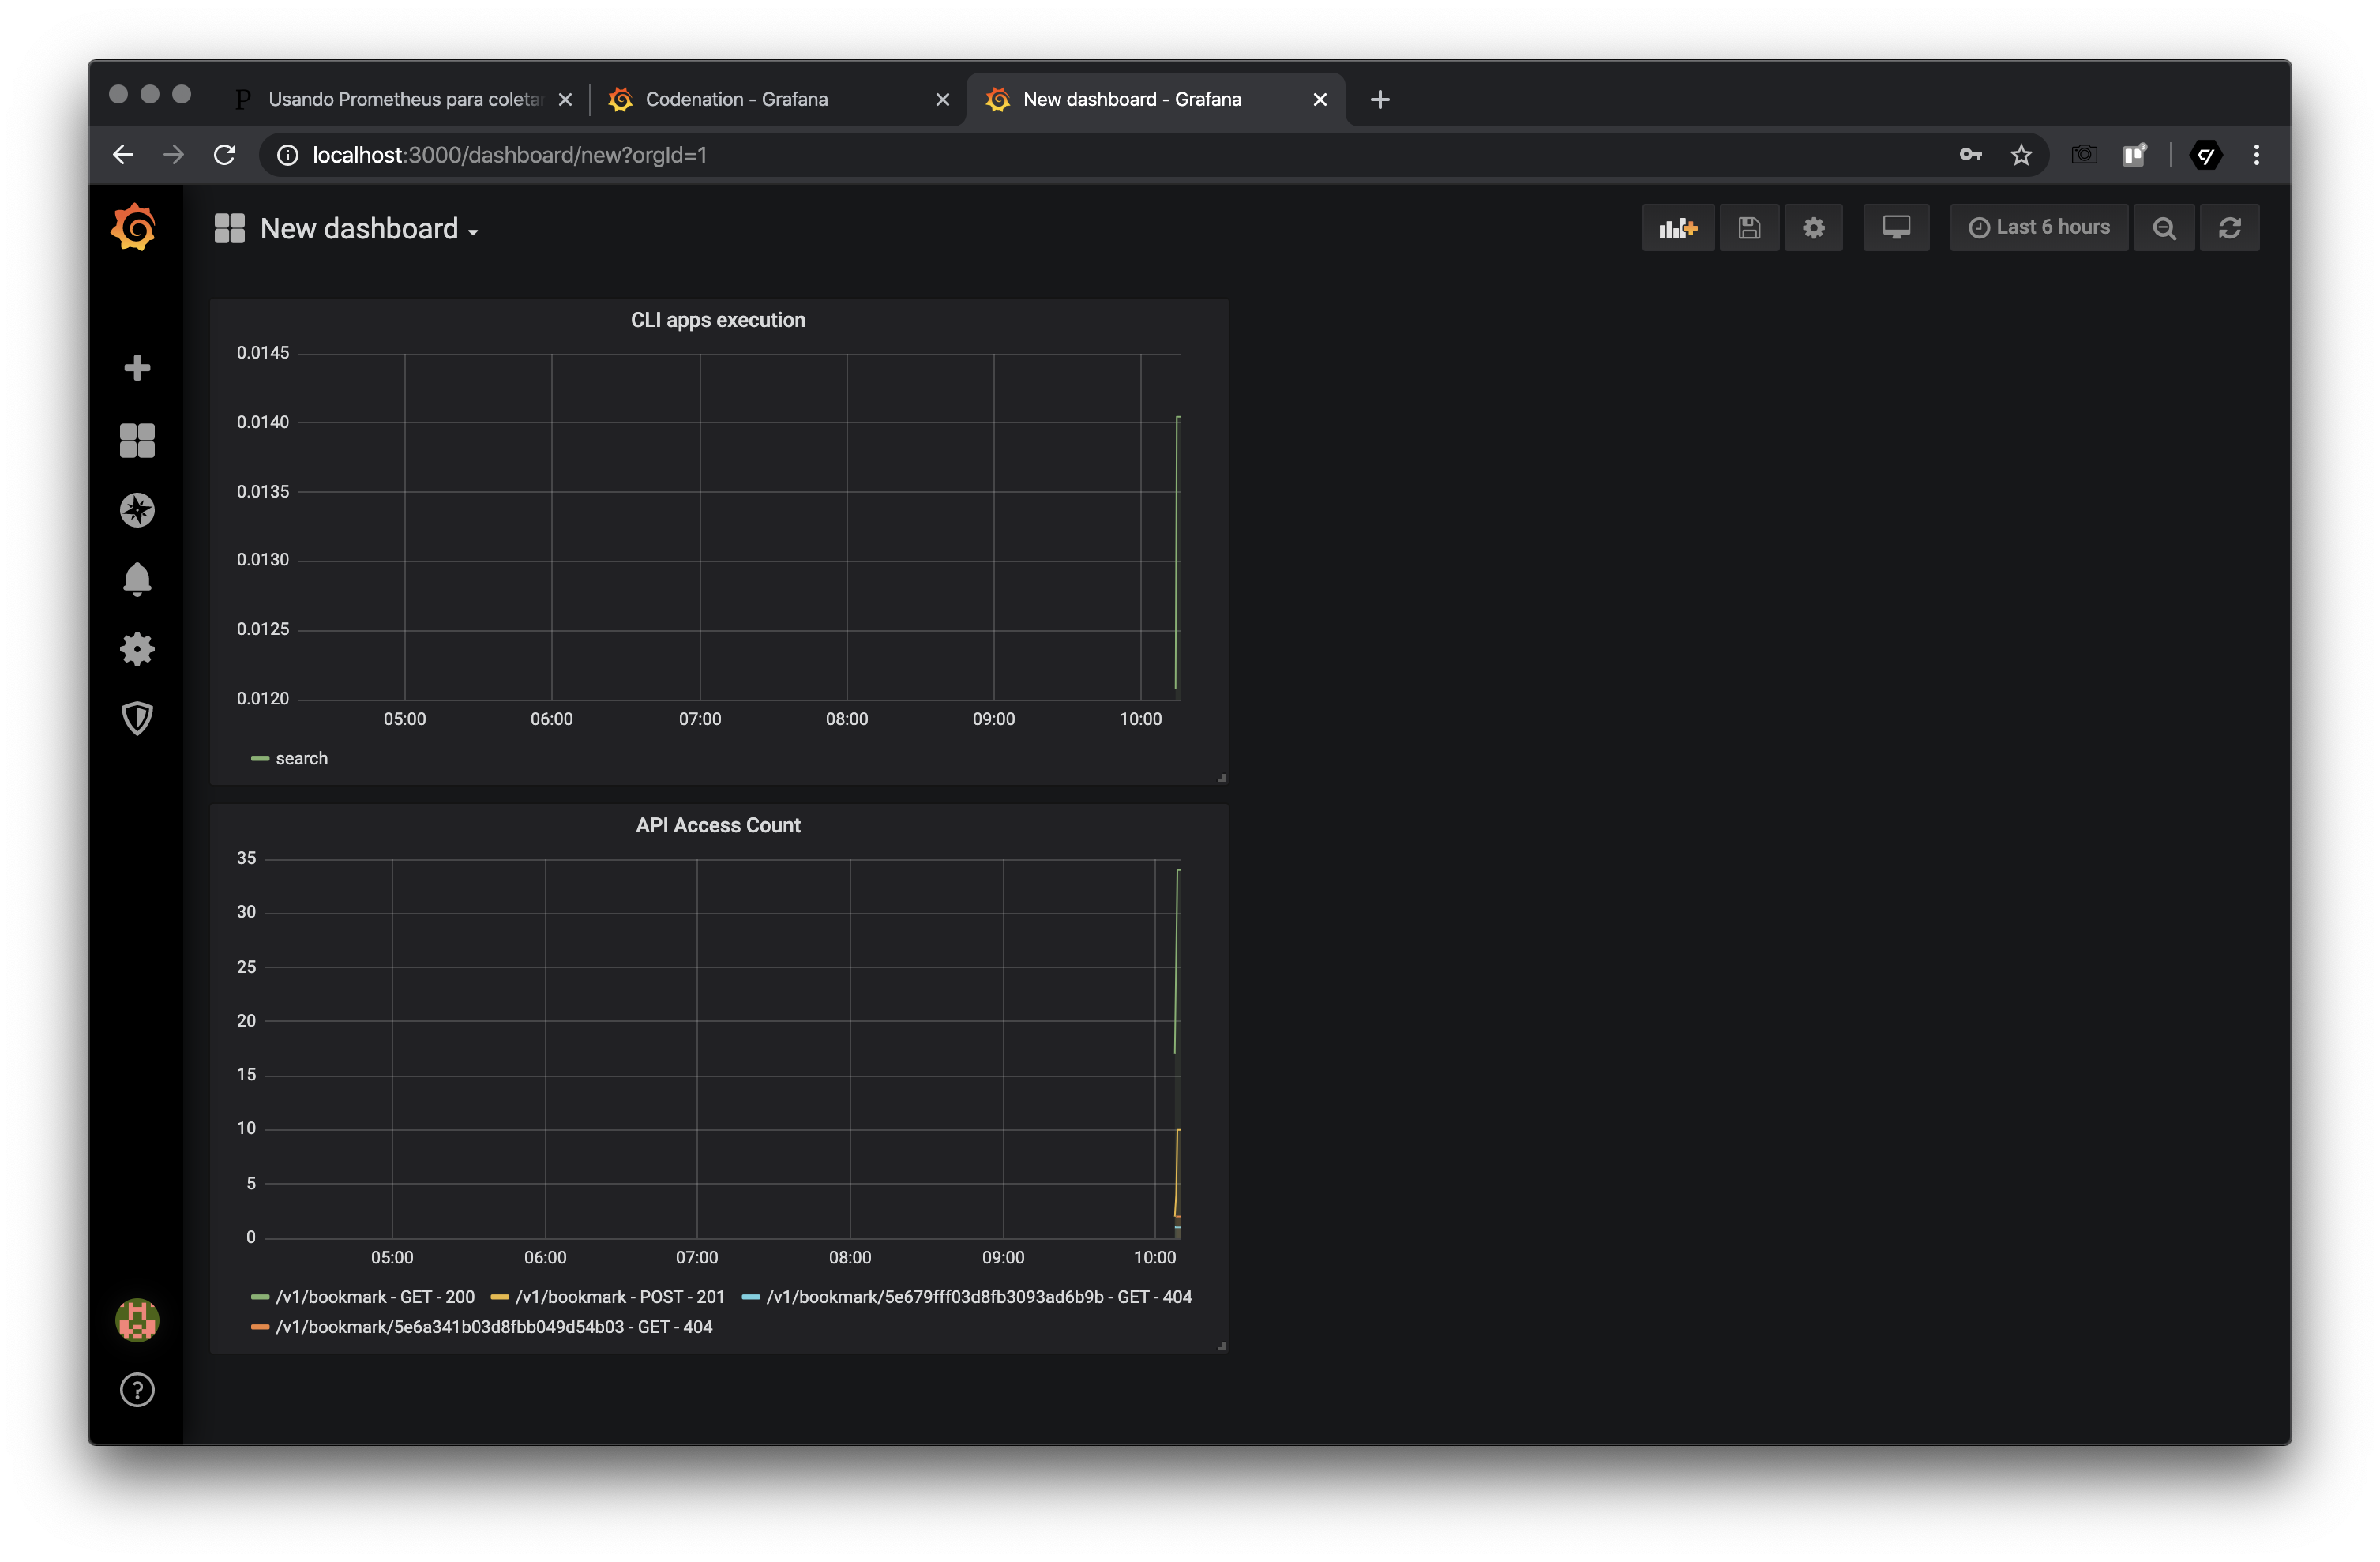
As the apps collect the metrics, it will update the data on the dashboard. It is possible to add other panels, with more advanced queries. There are more advanced examples in the Prometheus and Grafana documentation.
Conclusion
In this post my goal was to show how relatively simple it is to add the metrics feature to Go applications. An extra point is the fact that we are using Clean Architecture, which allows us to move from Prometheus to another solution by creating a new implementation of the metric.UseCase and just change few configuration lines. These metrics have helped us to better understand the behavior of our application and have facilitated some implementation decisions and improvements. I hope this post can be useful, so that more projects also have these benefits.
All the codes presented in this post are in the repository https://github.com/eminetto/clean-architecture-go